Los patrones de continuidad reflejan la posibilidad de continuación de la tendencia actual del mercado y conocerlos nos ayudará en nuestro trading. Muchas veces escuchamos que el trading se está volviendo popular. Contar con modelos específicos para determinar la dirección futura del mercado será fundamental para maximizar el valor de nuestras operaciones.
Continuation patterns generally form during a market break, either supply or demand, which causes the price to move sideways and then continue to move in the same direction as the trend preceding the price pattern. An important difference between continuous and variable samples is their duration over time. Reversal patterns take slightly longer and represent larger changes in the trend. Continuous patterns can be shorter and, although quite common, are sometimes unreliable.
Tabla de contenidos
Continuity patterns
Triangles
Triangles are usually continuous patterns, although sometimes they act as changing patterns. The minimum requirement to form a triangle is to have at least four points: two for the bottom line and two for the top line. Triangular continuation patterns can be divided into three types according to their shape and, although what really matters is the direction in which the market moves when the price exits the triangle pattern.

Symmetrical triangle
A symmetrical triangle forms when the market makes higher lows and lower highs and is often associated with a directionless market because the narrowing of the market shows that both bulls and bears are in control.
It shows two converging lines: an upper descending line (formed by highs) and a lower ascending line (formed by lows). The vertical line on the left that measures the height of the pattern is called the «base» and the point where the two lines on the right cross is called the «apex». The continuation pattern is completed when the support line of the lows or the resistance line of the peaks goes beyond the triangle. The symmetrical triangle pattern is neutral and cannot be called a continuation pattern because the direction of the breakout predicts the next move in the market. If this pattern forms during an uptrend, it is considered a continuation if the market breaks to the upside and a reversal pattern if the market breaks to the downside. Similarly, if it forms during a downtrend, it is considered a continuation pattern if the market breaks down and a reversal pattern if the market breaks down.
In the following chart we see a downtrend and after the pause given by the triangle, the trend should resume.
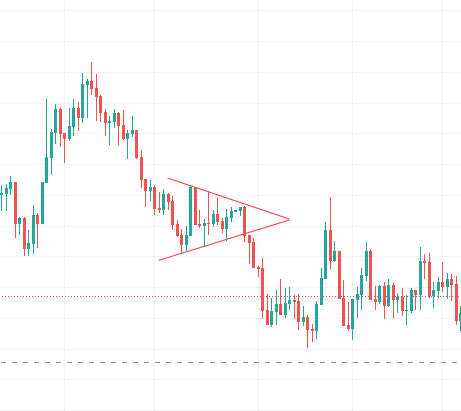
As time passes and a symmetrical triangle forms, the range narrows and volume tends to decrease.
Two methods can be used to estimate the price level that will be reached after the symmetrical triangle breaks. The first is to measure the maximum distance between the two lines forming the triangle and apply it to the breakout. The second method consists of drawing a line parallel to the lower line of the triangle for a bullish breakout and a line parallel to the upper line for a bearish breakout. This new line represents a possible target.
Ascending triangle
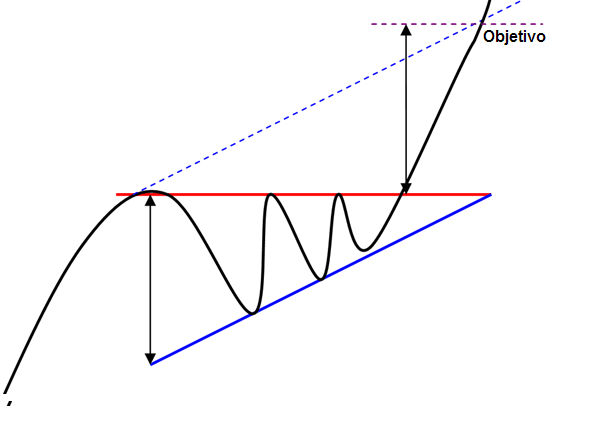
An ascending triangle is formed when the market makes lower lows and higher highs at the same level. These continuation patterns are often seen during an uptrend and indicate that the bulls are attempting to take control by moving toward the pattern’s upper resistance line. However, if it appears in a downtrend, it can act as a signal of a trend change.
The bullish support line formed by the low tells us that sellers are starting to exit the asset. The upper horizontal line formed by peaks represents resistance that prevents the price from rising above a certain level. Usually, when a triangle is formed, buying pressure builds up until it finally breaks the bullish resistance, giving the ascending triangle a bullish continuation pattern. In the following chart, we can see a triangle developing in a bullish market
Descending Triangle
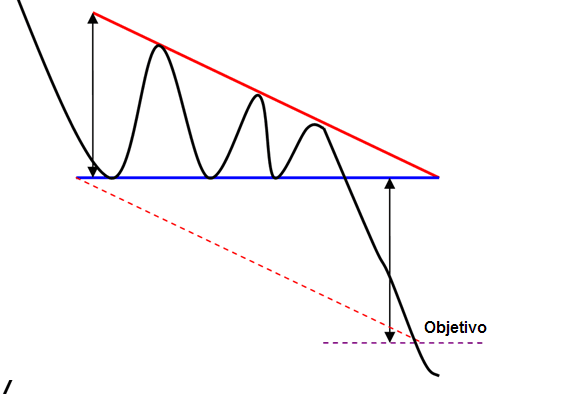
A descending triangle is formed when the market makes lower highs and lower lows of the same level. These patterns are commonly seen in downtrends and appear as continuation patterns when bearish traders attempt to take control by moving toward the pattern’s support line. However, if it appears in an uptrend, it can act as a signal of a trend change.
The lower horizontal line formed by the lows represents the need to prevent the analyzed instrument from falling below a certain level and acts as support. Although the price was unable to break below this level, the lower and lower highs, indicating increased selling pressure, made this pattern bearish. The pattern is completed and confirmed when the price is well above the horizontal support line. In the chart below, we see a descending triangle in a bear market.